I have my B2G device in hand….. how do I start gathering memory statistics for the apps I use.
Firstly git clone the b2g repo >
git clone https://github.com/mozilla-b2g/B2G
cd B2G /tools
python get_about_memory.py –help
There are several options you might want to consider with the tool, for now you can just run without any options.
Next Open Firefox Aurora or Nightly, and type about:memory. At the bottom of the page is a button for loading the memory report from File.
Select and open the file you just saved in B2G/tools/about-memory
Analysis:
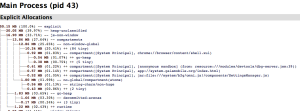
B2G About memory report is organized by pid. Each app has it’s own process so you can expect to see that represented by different processes within the architecture. The B2G main process is featured below. Memory is allocated and deallocated as memory is cleaned up. The garbage collector is then over time triggered to return memory to the system.
Different Processes can be seen each with it’s own heap / memory compartments.etc.etc.
There are a few things that we want to watch out for in a memory dump, and I am hoping that the *community* can help lead us along and let us know when you see something odd, or inexplicable.
Tips:
Heap unclassified should not keep growing as you use an app or do a specific action. A heap unclassified > 50MB is cause for concern.
If you are running out of memory, especially if you can get a dump of what is growing that is extremely helpful. The best kind of memory leaks are the kind that are slowly eat memory each time you perform a specific action.
In this scenario you can take several about memory readings and you should see memory increasing. Now a next step at this point would be to run get_about_memory -m . This will run the garbage collector prior to gathering the memory run, now when you inspect the memory report, has memory usage returned to normal ?
There are two scenarios you are trying to figure out at this point, is this the lack of the garbage collector running, or are we loosing track of memory causing the applications memory to get too large. There is also the possibility that the webapp is just consuming too many resources and it is causing OOM, and there is nothing to be done for it, but to work to optimize the webapp for a smaller footprint mobile device.
Another warning sign that the system is running out of memory is also an error dumped to console “adb logcat” or you can run adb shell dmesg and you will see a SIG KILL message whenever an app has been killed by the memory manager.
Some of this is really just taking time and going through the memory report, and feeling comfortable with the numbers, and what pieces are expanding / contracting, and how this is affecting overall memory usage.
Lastly:
Don’t worry if you don’t understand things entirely at first. You can hover over specific entries and it will provide helpful tooltips. Also remember your brain is excellent at picking out patterns, and recognizing anomalies even if you don’t think you are learning anything .. you ARE !!!!!!


